CLO Equity Index

Index Description

The Flat Rock CLO Equity Returns Index seeks to measure the unlevered, gross of fee performance of US CLO equity tranches as represented by the market-weighted performance of the underlying assets of funds that publicly disclose their holdings and fair market values to the U.S. Securities and Exchange commission.  The reporting funds satisfy certain eligibility criteria. The index inception date is September 30, 2014.  The index is calculated quarterly on a 75-day lag.

There was an issue displaying the chart. Please edit the chart in the admin area for more details.

Last Quarter Index Commentary

During 3Q23, CLO equity rose 10.5% as the market rallied on the back of increased expectations for a soft landing.  The Morningstar LSTA leveraged loan index was up 132bps, rising from 94.24 to 95.56.

Index Characteristics3Q2023
CLO AUM at Fair Value $1,897,732,845
Number of CLOs429
Number of firms providing marks5
One Year ReturnThree Year Return AnnualizedFive Year Return AnnualizedAnnualized Return since inception on 9/30/2014Maximum Quarterly DrawdownMaximum Quarterly Drawdown PeriodStandard Deviation of Returns
15.7%19.6%4.3%6.5%-30.4%
1Q202020.5%

Read the eBook  “An Introduction to CLO Equity”

by Shiloh Bates

Introduction to CLO Equity_2022


CLO equity offers the potential for mid-teens returns with low correlation to other asset classes like equities or high yield bonds. CLO equity allows investors to gain exposure to a highly diversified pool of broadly syndicated loans using attractive built-in leverage that’s locked in for the life of the CLO.

Do AAA-Rated CLOs

Pose a Risk to the Financial System?


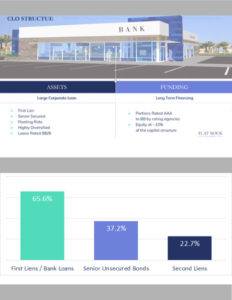
Since the GFC, the structures of CLOs became more debt friendly, with shorter CLO reinvestment periods, higher debt costs, more equity subordination and stricter limitations on the types of securities that can be included in the CLO.  All of these make it less likely that a CLO AAA-rated note will default this time around.    

CLO Equity 2020

Year in Review

Year-in-Review-Graphic


2020 started off with a sharp Covid-related sell-off. As parts of the economy shut down, default expectations for the underlying CLO loans increased and the CLO equity index declined by 30.41% in the first quarter. Click the image above to read the full post by Flat Rock Global Managing Director Shiloh Bates

DateIndex LevelQuarterly ReturnYearly Return
30-Sep-14100.00
31-Dec-14100.210.21%
31-Mar-15101.020.80%
30-Jun-15102.371.34%
30-Sep-1594.71-7.48%
31-Dec-1583.92-11.39%-16.26%
31-Mar-1683.57-0.42%
30-Jun-1697.5916.78%
30-Sep-16111.9714.74%
31-Dec-16124.8811.53%48.81%
31-Mar-17125.640.61%
30-Jun-17130.363.75%
30-Sep-17128.54-1.39%
31-Dec-17134.114.33%7.39%
31-Mar-18138.533.29%
30-Jun-18139.590.77%
30-Sep-18142.522.10%
31-Dec-18121.72-14.59%-9.24%
31-Mar-19133.559.72%
30-Jun-19133.13-0.31%
30-Sep-19119.74-10.06%
31-Dec-19121.001.05%-0.59%
31-Mar-2084.21-30.41%
30-Jun-2090.617.60%
30-Sep-20102.8313.49%
31-Dec-20132.51
29.89%
9.51%
31-Mar-21144.499.04%
30-Jun-21156.878.57%
30-Sep-21169.097.79%
31-Dec-21172.151.81%29.91%
31-Mar-22168.63
-2.04%
30-Jun-22147.58-12.49%
30-Sep-22152.053.03%
31-Dec-22152.220.11%-11.58%
31-Mar-23155.972.46%
30-Jun-23159.192.07%
30-Sep-23175.9210.5%